Visualization
Visualizing the results is the key process of the atmospheric and oceanic data analysis. Since Python is an open-source programming language, there are more than one options for visualizing the result. Those include PyNGL by NCAR, Visualization Control System by UV-CDAT and Matplotlib. In the class, we will focus on Matplotlib.
Matplotlib
Matplotlib is a Python 2D plotting library which produces publication quality figures in a variety of hardcopy formats and interactive environments across platforms. Matplotlib can be used in Python scripts, the Python and IPython shells, the Jupyter notebook, web application servers, and four graphical user interface toolkits. The visualization work you can do with Matplotlib has a wide range of spectrum. To see examples, visit the gallery page.
Matplotlib is the whole package, and most plotting tasks can be done with matplotlib.pyplot, a module in matplotlib.
To use this module, we can import it using the same command we used for numpy.
import matplotlib.pyplot as plt
Unless otherwise stated, you may assume in the examples in this chapter that the above import has been done prior to any matplotlib calls being run.
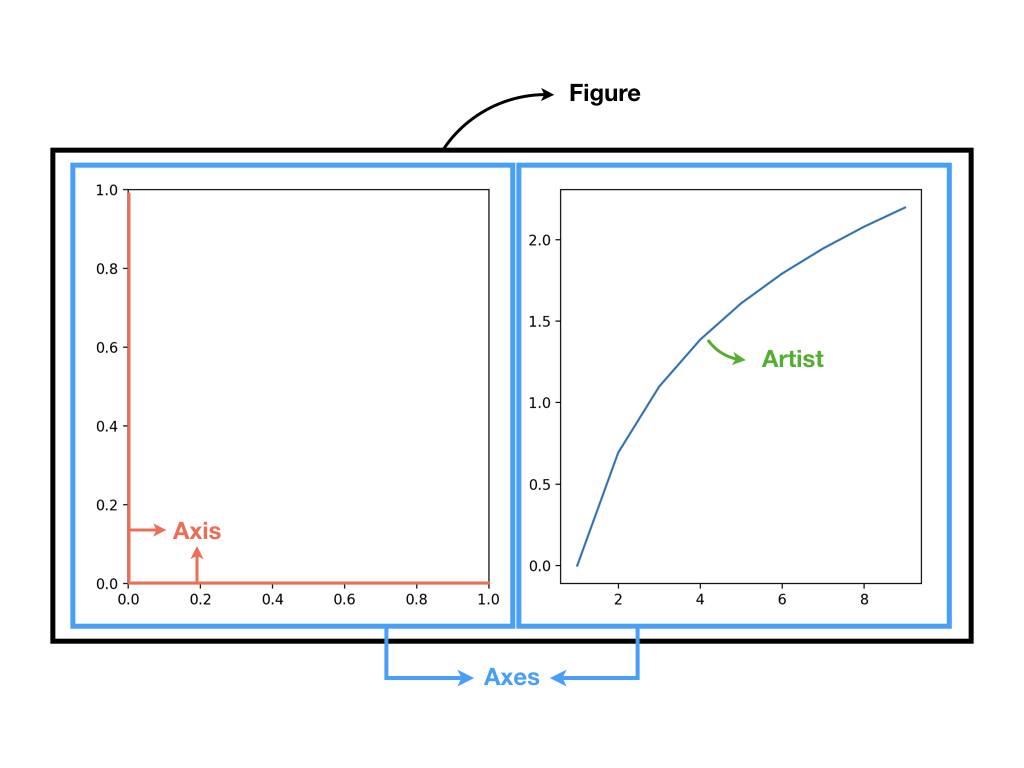
Parts of a Figure
Figure
The figure represents the whole space where plots are shown. A figure can have any number of axes where the actual drawing are happening.
Axes
This is a area where ‘a plot’ is going to be drawn using the data. There can be more than one axes in a single figure. The Axes contains two (or three in the case of 3D) Axis objects.
Axis
These are the number-line-like objects. They take care of setting the graph limits and generating the ticks and ticklabels. There are 2 axis along each direction in 2D figures, but can be three for 3D figures.
Artist
Basically everything you can see on the figure is an artist (even the Figure, Axes, and Axis objects). This includes Text objects, Line2D objects, collection objects, Patch objects … (you get the idea). When the figure is rendered, all of the artists are drawn to the canvas. Most Artists are tied to an Axes; such an Artist cannot be shared by multiple Axes, or moved from one to another.
The sample of matplotlib can clarify these concepts.
Interactive mode
When you make plots, you can choose to make them interactively, meaning deciding the next step after getting the intermediate results. Or, you can write down all the commands once and let matplotlib interprete them to the plot, which is non-interactive.
To turn on the interactive mode, you can use plt.ion(). To turn it off and come back to the non-interactive mode (which is the default), type plt.ioff().
For example,
import matplotlib.pyplot as plt
plt.ion()
plt.plot([1.6, 2.7])
Then we can keep adding more texts because the interactive mode is on.
plt.title("interactive test")
plt.xlabel("index")
and you will see the plot being updated after each line.
To go back to the non-interactive mode,
plt.ioff()
plt.plot([1.6, 2.7])
As you can see, nothing happends in contrast to the previous example. To have the figure, we need to say plt.show().
Now you see the plot, but your terminal command line is unresponsive; the show() command blocks the input of additional commands until you manually kill the plot window.
What good is this–being forced to use a blocking function? Suppose you need a script that plots the contents of a file to the screen. You want to look at that plot, and then end the script. Without some blocking command such as show(), the script would flash up the plot and then end immediately, leaving nothing on the screen.
In addition, non-interactive mode delays all drawing until show() is called; this is more efficient than redrawing the plot each time a line in the script adds a new feature.
Obviously, we cannot cover all the functions of Matplotlib in the class. Instead, we will explore basic plotting functions such as plot, imshow, contour and pcolormesh.